Decay of coherent state of a resonator
This is an example demonstrating open system simulation methods - exponentiation of Lindblad superoperator and ODE solver. We consider a simple model of decay of a coherent state in a resonator for this example.
import matplotlib.pyplot as plt

import numpy as np
import jax.numpy as jnp

from paraqeet.quantity import Quantity
from paraqeet.signal.envelopes import ZeroEnvelope
from paraqeet.model.drive_operator import DriveOperator
from paraqeet.signal.iq_mixer import IQMixer
from paraqeet.model.resonator import Resonator
from paraqeet.model.open_system import OpenSystem
1. Using ScipyExmp
Exponentiating the full Lindbladian super-operator
tone = ZeroEnvelope()
gen = IQMixer(envelopes=[tone])
freq = 6.02e9 * 2 * np.pi
dims = 5

drive = DriveOperator(gen, is_longitudinal=False)
resonator = Resonator(
    frequency=Quantity(freq, 0.8 * freq, 1.2 * freq),
    drives=[drive],
    dimension=dims,
    t1=Quantity(value=10e-9, min_value=10e-9, max_value=1000e-9, unit="s"),
    t2star=Quantity(value=50e-7, min_value=10e-9, max_value=100e-6, unit="s"),
    temp=Quantity(value=50e-3, min_value=10e-3, max_value=10e-2, unit="K"),
)
model = OpenSystem(resonator)
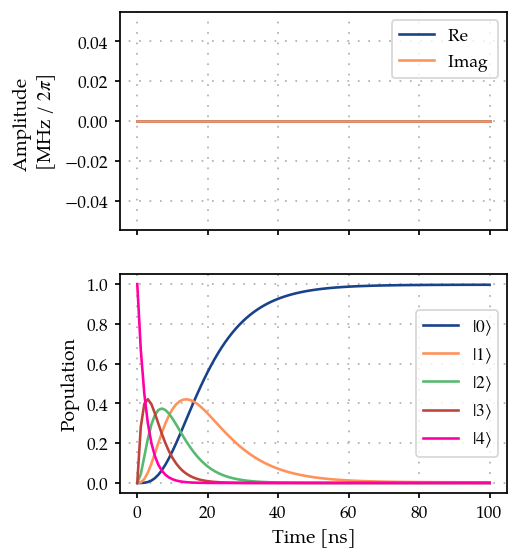
1. Fock state decay -
def generate_basis_state(dim: int, index, dm=False):
    """Generate a basis state for one subsystem."""
    if index >= dim:
        raise Exception("Index has to be less than dimension")

    state = np.zeros(dim)
    state[index] = 1

    state = jnp.reshape(state, (-1, 1))

    if dm:
        state = state @ state.conj().T
    return state


init_dm = generate_basis_state(dims, 4, dm=True)
init_dm
array([[0., 0., 0., 0., 0.],
       [0., 0., 0., 0., 0.],
       [0., 0., 0., 0., 0.],
       [0., 0., 0., 0., 0.],
       [0., 0., 0., 0., 1.]])
from paraqeet.propagation.scipy_expm import ScipyExpm

t_final = 100e-9
ts = np.linspace(0, t_final, 101)

prop = ScipyExpm(model, res=100e9)
prop.set_initial_state(init_dm)
from plotting import plot_signal_and_dynamics

ts = np.linspace(0.0, t_final, 101)
plot_signal_and_dynamics(gen, prop, ts, state_labels=[rf"$|{i}\rangle$" for i in range(dims)]);
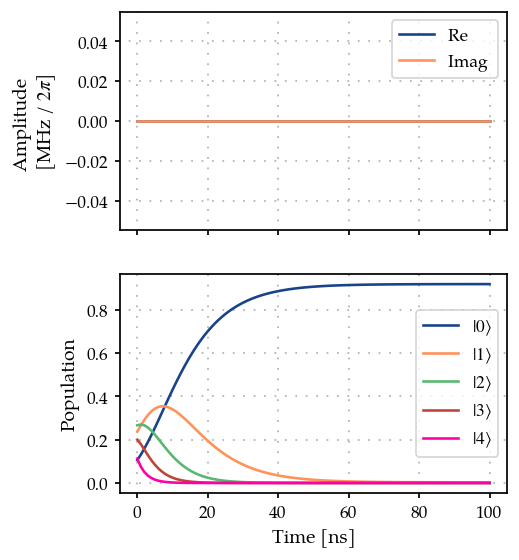
2. Coherent state decay -
from jax import vmap
from jax.scipy.special import factorial
def calculate_populations(states, dm=False):
"""Calculate state populations from density matrices and vectorized dm."""
if len(states.shape) > 2:
if dm:
pops = jnp.abs(vmap(jnp.diag, in_axes=0)(states))
else:
pops = jnp.abs(states[:, :, 0]) ** 2
pops = jnp.reshape(pops, [pops.shape[0], pops.shape[1]])
else:
if dm:
pops = jnp.diag(states)
else:
pops = jnp.abs(states) ** 2
return pops
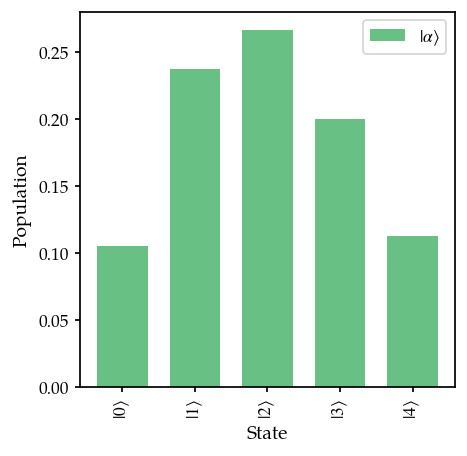
def generate_coherent_state(dim, alpha, dm=False):
"""Generate a coherent state for a given alpha."""
state = generate_basis_state(dim, 0, dm=False)
for n in range(1, dim):
state += ((alpha**n) / jnp.sqrt(factorial(n))) * generate_basis_state(dim, n, dm=False)
state = jnp.exp(-0.5 * jnp.abs(alpha) ** 2) * state
if dm:
state = state @ state.conj().T
return state
coherent_state = generate_coherent_state(dims, 1.5, dm=True)
plot coherent state populations
def plot_population_distribution(
    states,
    dims,
    state_labels,
    dm=False,
    labels=None,
    xticks_spacing=3,
    grid=True,
    title="",
    colors=None,
    alpha=1.0,
    grid_alpha=0.7,
    figsize=(3, 3),
    show_legend=True,
    barwidth=None,
):
    """Plot state occupation as a bar plot."""
    pops = []
    for i in range(len(states)):
        pops.append(calculate_populations(states[i], dm=dm))

    def get_plot_params_dict(index):
        plot_parms_dict = {"alpha": alpha}
        if colors is not None:
            plot_parms_dict["color"] = colors[index]
        if labels is not None:
            plot_parms_dict["label"] = labels[index]
        if barwidth is not None:
            plot_parms_dict["width"] = barwidth
        return plot_parms_dict

    fig = plt.figure(figsize=figsize)
    ax = fig.add_axes([0, 0, 1, 1])

    for i in range(len(states)):
        ax.bar(range(len(state_labels)), pops[i], **get_plot_params_dict(i))

    xticks_latex = []
    for i in state_labels:
        if len(dims) > 1:
            xticks_latex.append(rf"$|{i}\rangle$")
        else:
            xticks_latex.append(rf"$|{i[0]}\rangle$")

    ax.set_xticks(
        ticks=range(len(state_labels))[::xticks_spacing],
        labels=xticks_latex[::xticks_spacing],
        rotation="vertical",
    )

    if show_legend:
        ax.legend()

    if grid:
        ax.grid(grid, linestyle=":", alpha=grid_alpha)
    ax.set_title(title)
    ax.set_xlabel("State")
    ax.set_ylabel("Population")
state_labels = [(i,) for i in range(dims)]

plot_population_distribution(
    states=[coherent_state],
    dims=(dims,),
    state_labels=state_labels,
    dm=True,
    labels=[r"$|\alpha\rangle$"],
    grid=False,
    colors=["#57b977"],
    alpha=0.9,
    xticks_spacing=1,
    barwidth=0.7,
)

t_final = 100e-9
ts = np.linspace(0, t_final, 101)

prop = ScipyExpm(model, res=100e9)
prop.set_initial_state(coherent_state)

plot_signal_and_dynamics(gen, prop, ts, state_labels=[rf"$|{i}\rangle$" for i in range(dims)]);
2. Using Vern7
Using ODE solver to compute the state
Set model.ode_propagation = True
model.ode_propagation = True
1. Fock state decay -
from paraqeet.propagation.vern7 import Vern7

t_final = 100e-9
ts = np.linspace(0, t_final, 101)
init_dm = generate_basis_state(dims, 4, dm=True)

prop = Vern7(model, res=100e9)
prop.set_initial_state(init_dm)

plot_signal_and_dynamics(gen, prop, ts, state_labels=[rf"$|{i}\rangle$" for i in range(dims)]);

2. Coherent state decay
coherent_state = generate_coherent_state(dims, 1.5, dm=True)

state_labels = [(i,) for i in range(dims)]

plot_population_distribution(
    states=[coherent_state],
    dims=(dims,),
    state_labels=state_labels,
    dm=True,
    labels=[r"$|\alpha\rangle$"],
    grid=False,
    colors=["#57b977"],
    alpha=0.9,
    xticks_spacing=1,
    barwidth=0.7,
)
t_final = 100e-9
ts = np.linspace(0, t_final, 101)

prop = Vern7(model, res=100e9)
prop.set_initial_state(coherent_state)

plot_signal_and_dynamics(gen, prop, ts, state_labels=[rf"$|{i}\rangle$" for i in range(dims)]);
